
How to use Pie & Doughnut Chart Widget of Sky Addons for Elementor
The Pie & Doughnut Chart widget is a visual data tool that helps you represent parts of a whole in a clean, colorful, and interactive way. Built using the powerful Chart.js library and fully integrated into Elementor, it allows you to create both pie and doughnut style charts with complete styling flexibility. Whether you want to display survey results, user distribution, or resource usage, this widget is perfect for simplifying complex data into digestible visual chunks, all without writing a single line of code.
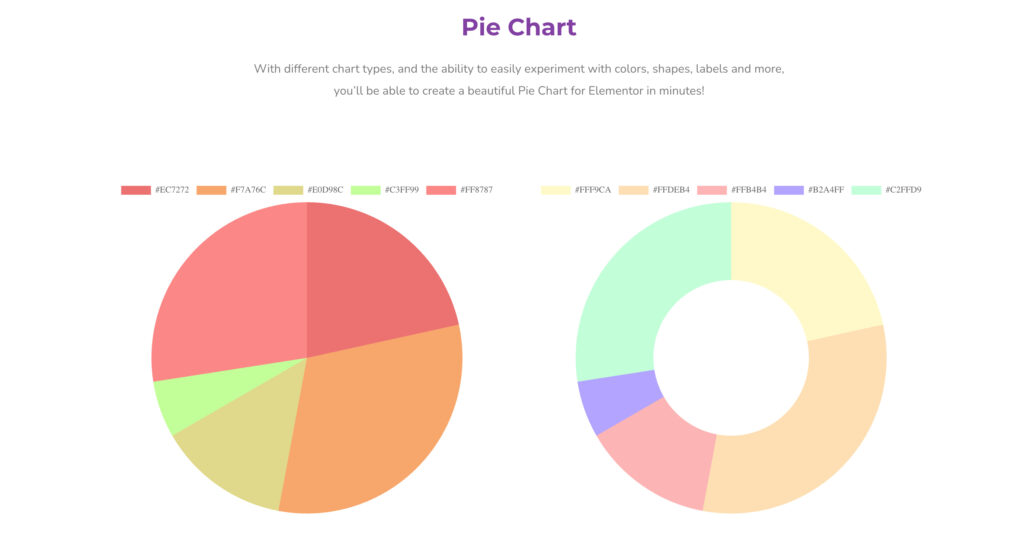
Features:
- Choose between Pie or Doughnut chart types
- Add multiple data sets with individual color control
- Interactive hover effects with tooltips
- Customizable labels, borders, and background
- Built-in animation support for engaging user experience
- Full customization using Elementor’s live editor
Insert Pie & Doughnut Widget
- Open Elementor Editor. In the Elementor panel, search for “Pie / Doughnut” under Sky Addons.
- Drag and Drop the Widget to the desired location on your page / editor.
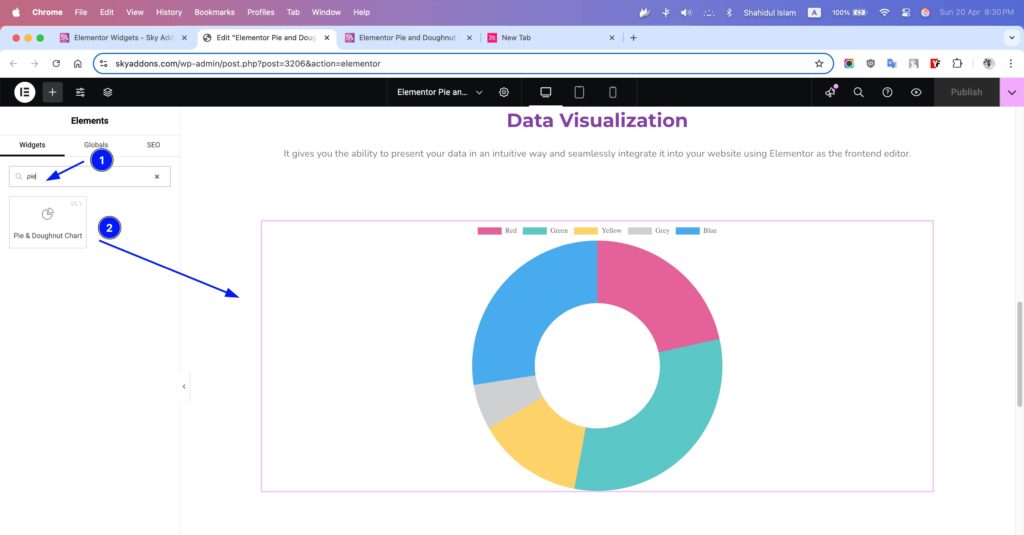
Chart Layout
- Chart Height – Define the height of the chart in pixels.
- Type: Choose between Pie or Doughnut layout.
- Slices – There is no separate label list. Each repeater item is one slice, and its Label names the slice in the legend and tooltip.
- Add Repeater (Dataset) – Add one item per slice, with the following:
- Label – Name of the slice.
- Data – The value of the slice, as one number.
- Background Color – Color of the slice.
- Background Hover Color – Color on hover.
- Border Color – Border color of the slice.
- Hover Border Color – Border color on hover.
- Hover Offset – How far the slice moves out on hover (0 to 20, default 4).
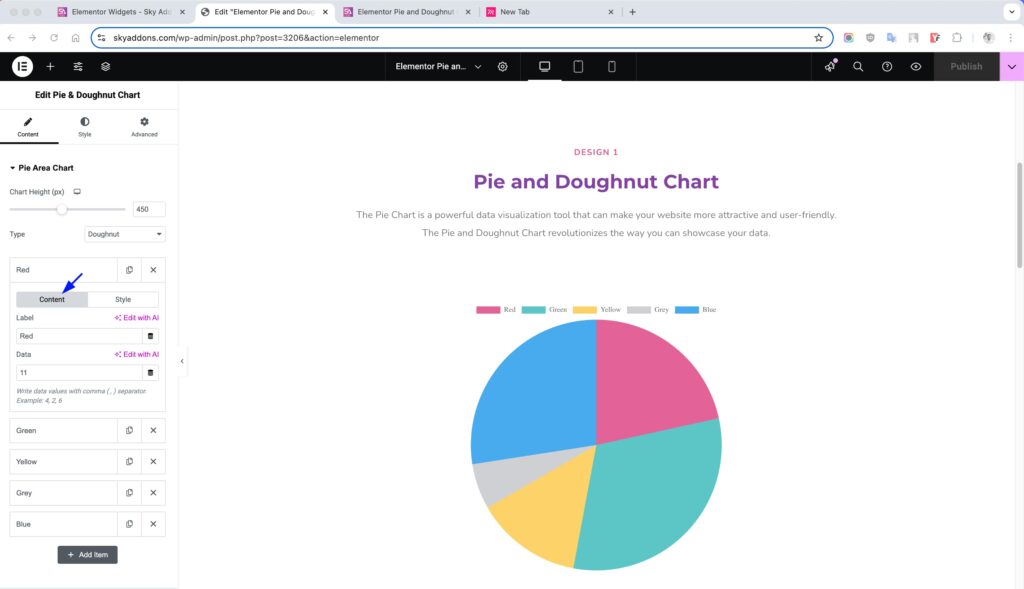
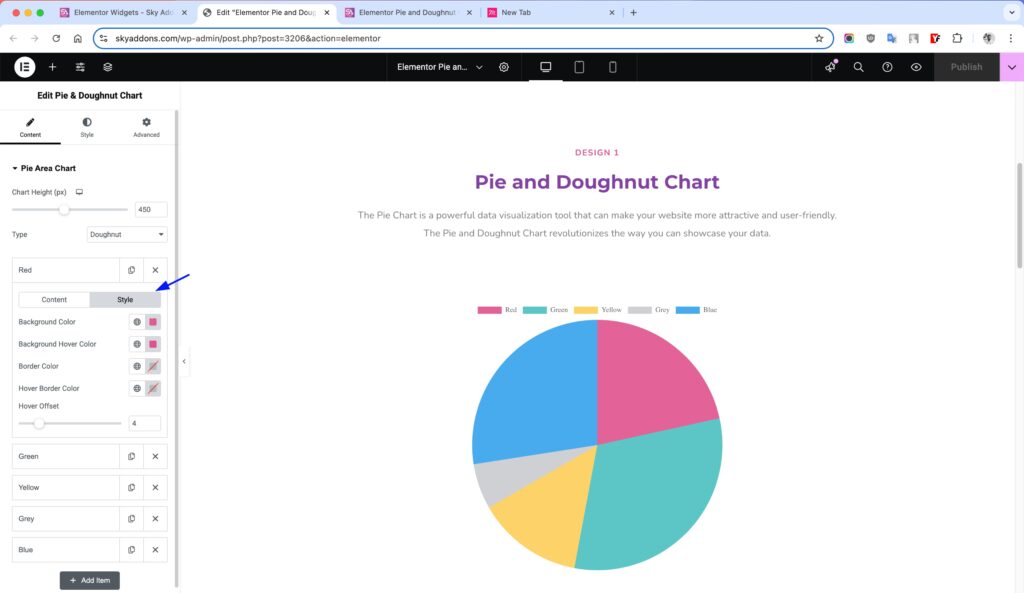
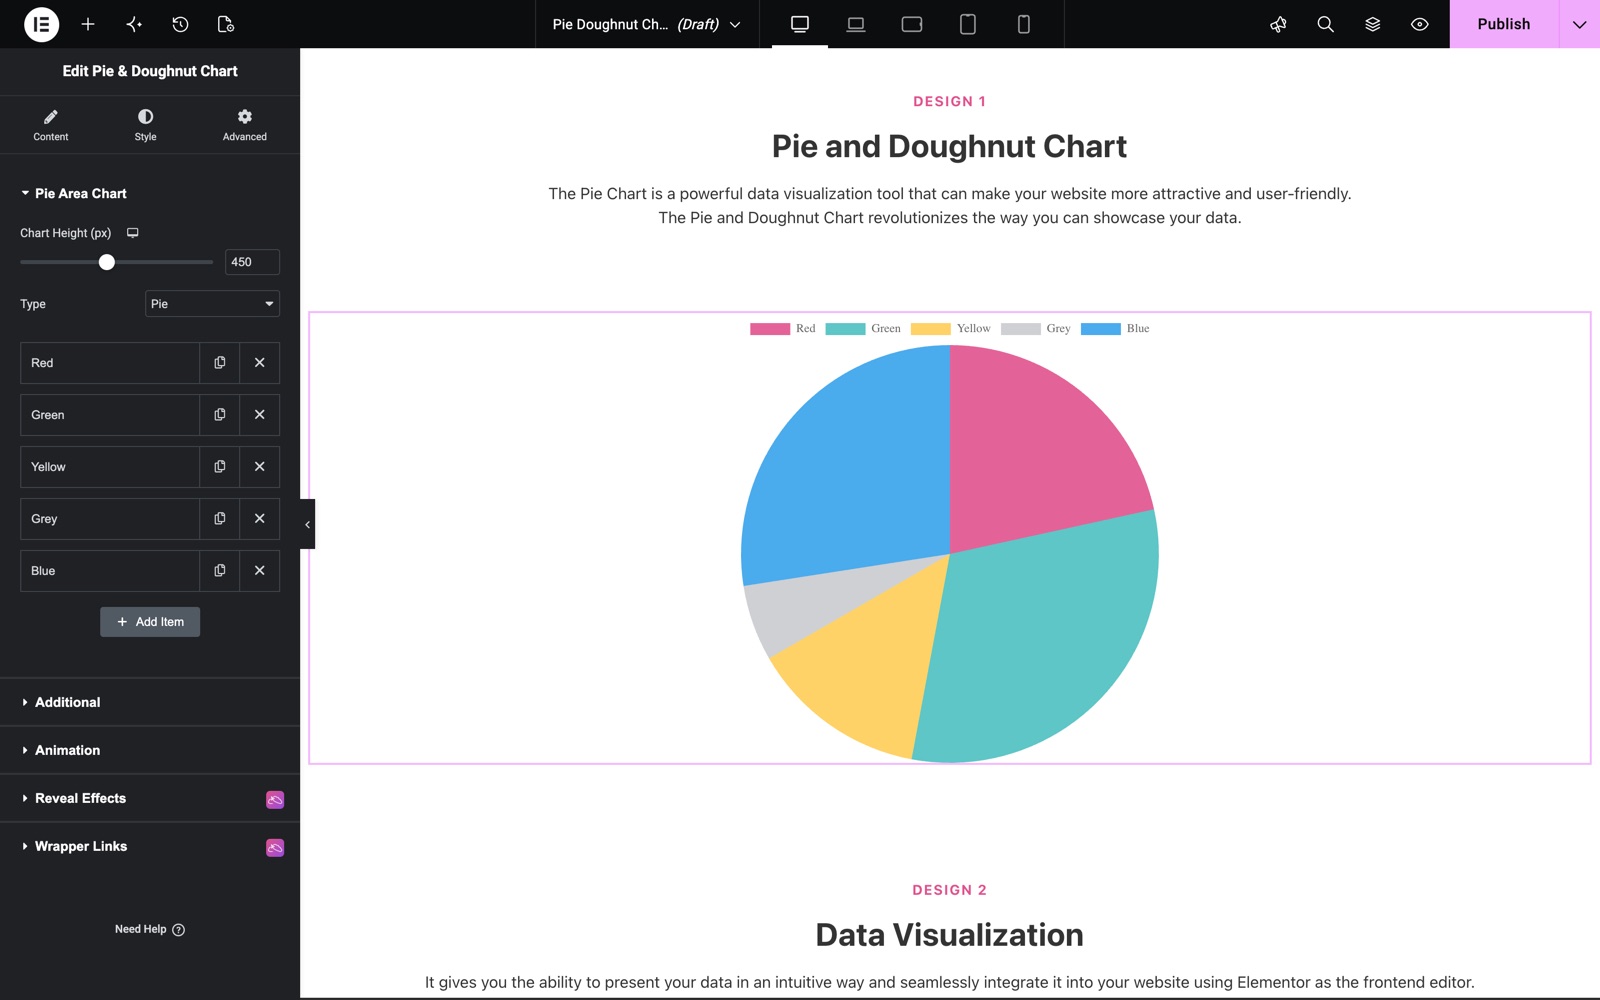
The first chart in the Pie & Doughnut Chart demo is 450 px tall with the Pie type and five slices: Red, Green, Yellow, Grey and Blue.
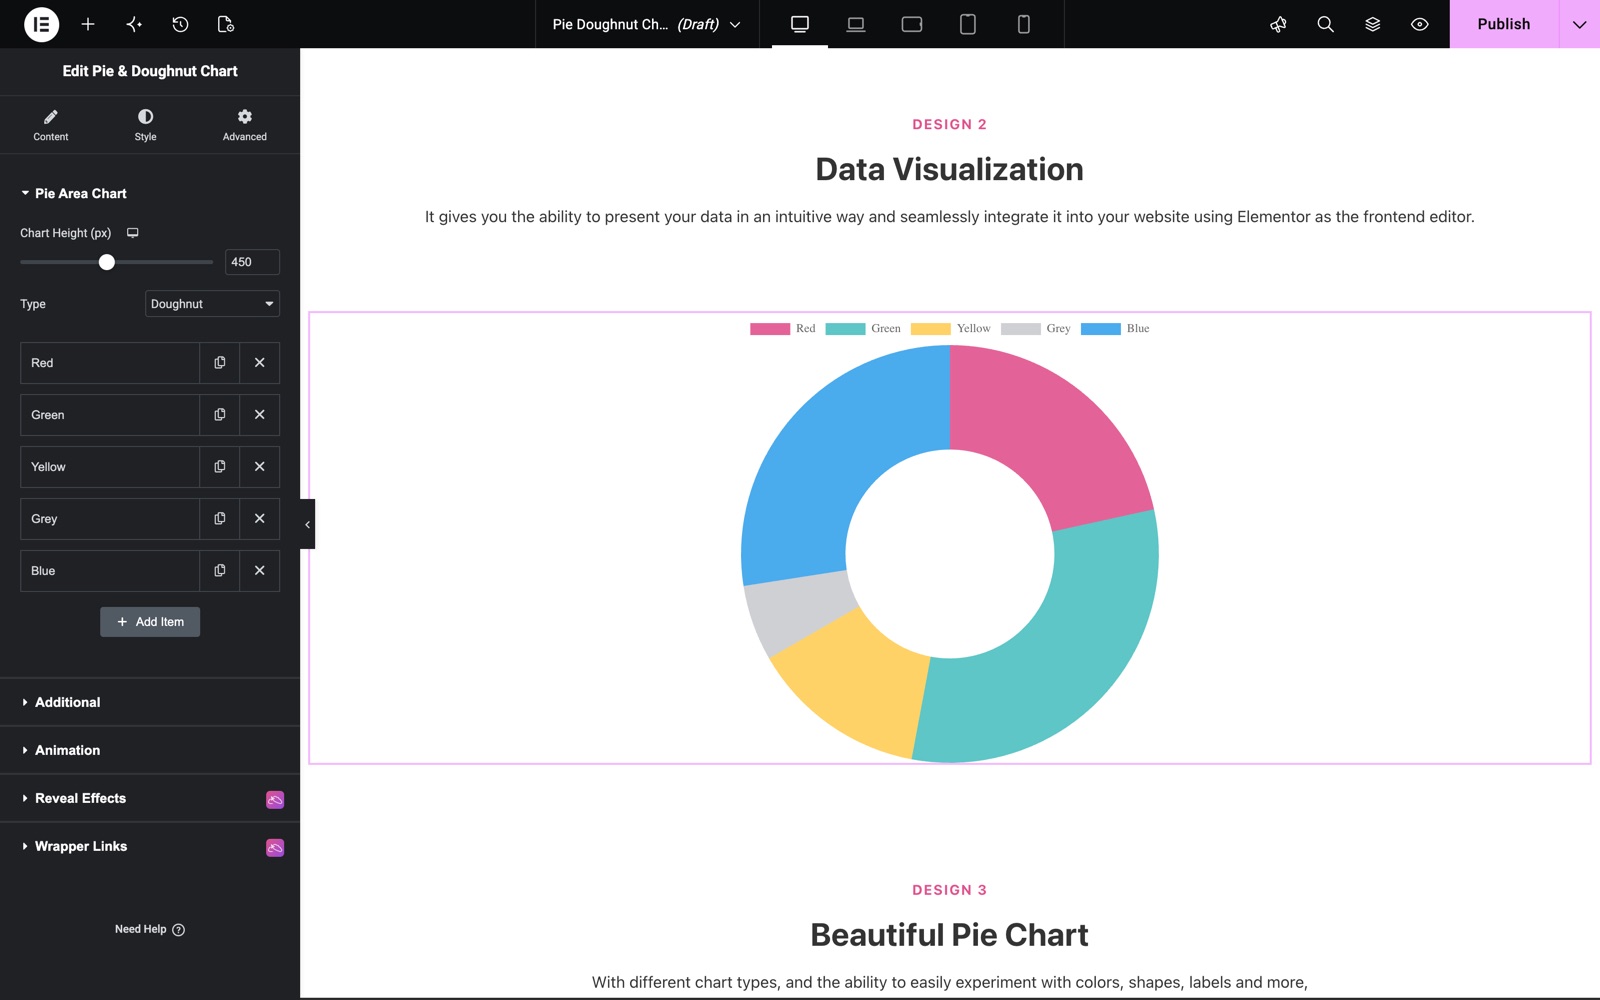
Switch Type to Doughnut and the same slices form a ring.
Additional Settings
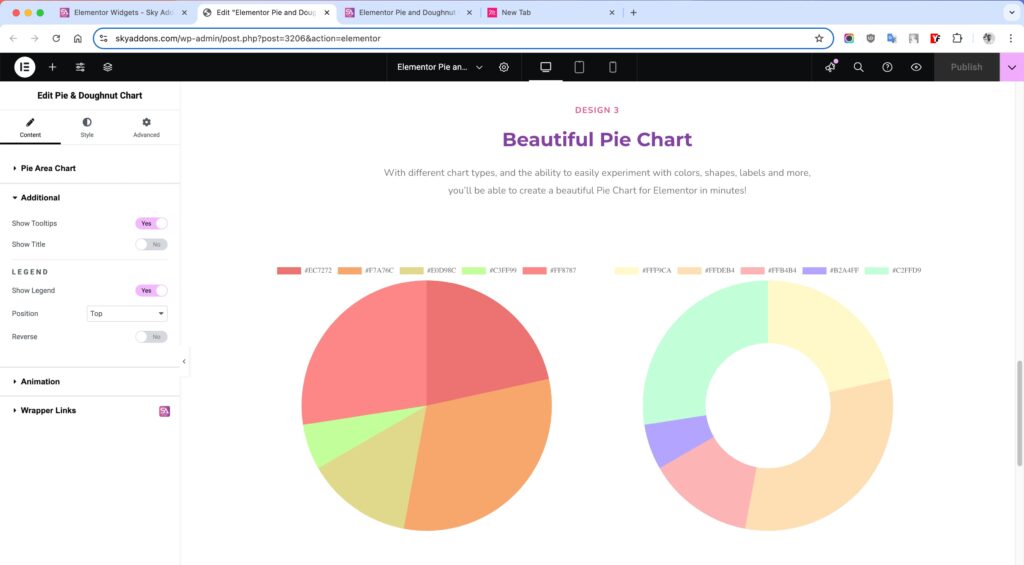
- Show Tooltips – Enable data tooltips on hover.
- Show Title – Display a chart title.
Legend Settings
- Show Legend – Toggle the legend display.
- Position – Select position: Top, Bottom, Left, or Right.
- Reverse – Reverse the order of legend items.
Animation Settings
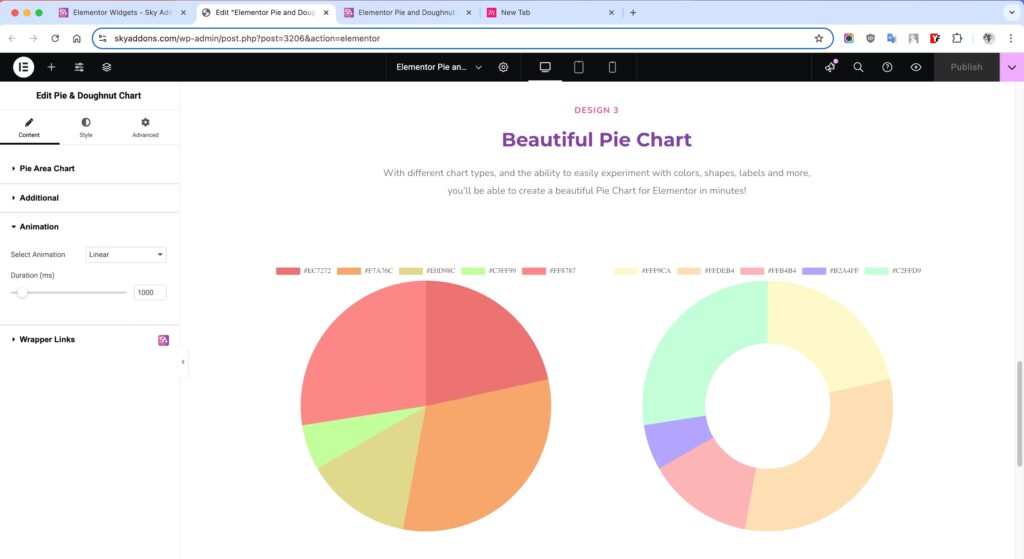
- Select Animation – Choose animation style.
- Duration – Set animation duration in milliseconds.
Style Customization
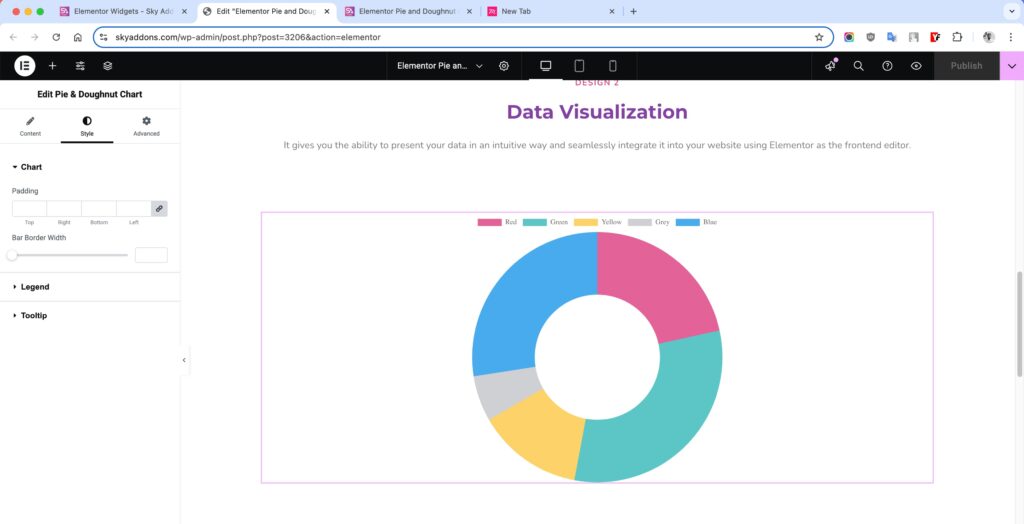
Chart Section
Customize the main chart area to align with your website’s layout and design.
- Padding – Adjust space around the chart to prevent overflow or tight layout.
- Bar Border Width – Define the thickness of the data line.
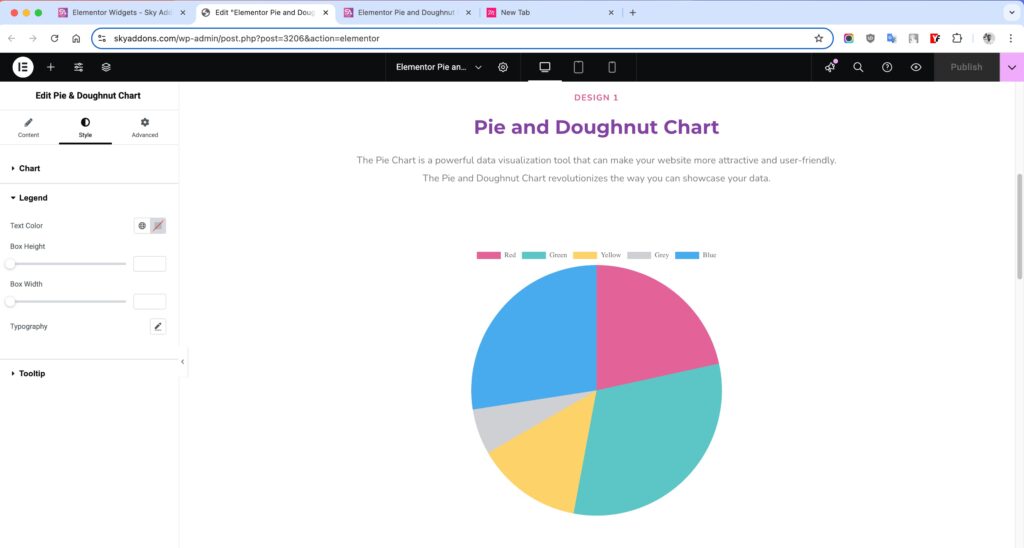
Legend Section
Style the legend that displays dataset labels for better readability and aesthetics.
- Text Color – Modify the color of the legend text to enhance visibility.
- Box Height / Width – Adjust the size of the colored legend markers beside each label.
- Typography – Fully control font family, size, weight, spacing, and style of legend text.
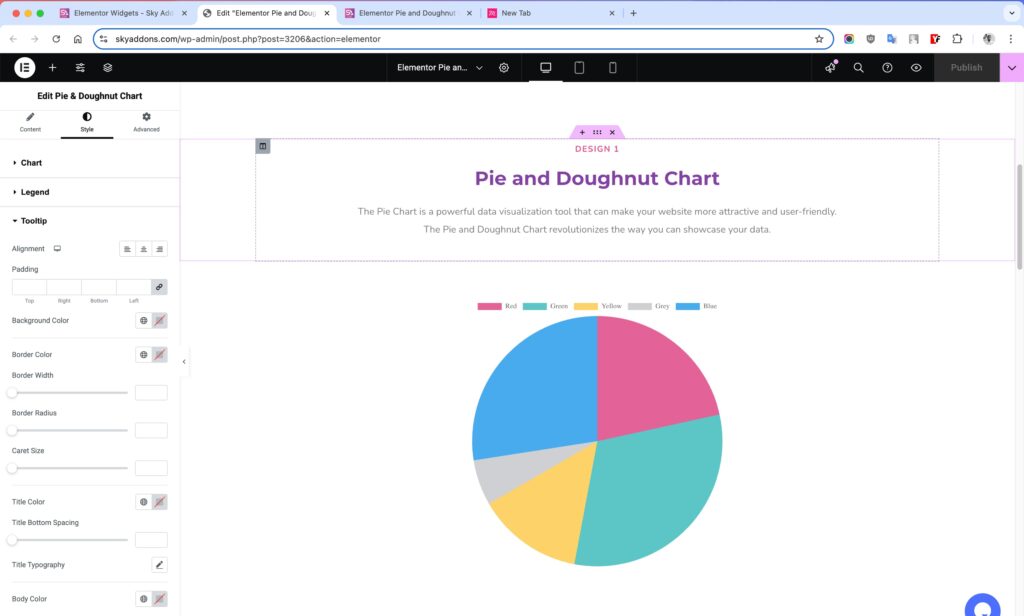
Tooltip Section
- Alignment – Set how tooltip content aligns inside the box (left/center/right).
- Padding – Add inner spacing so the content doesn’t feel cramped.
- Background Color – Set a custom background to match or contrast your site.
- Border Color / Width / Radius – Fine-tune the outline of the tooltip box.
- Caret Size – Adjust the size of the little arrow pointing to the bar.
- Title Color / Typography – Style the heading inside the tooltip.
- Title Bottom Spacing – Add space between the title and body.
- Body Color / Typography – Control the appearance of the detailed info shown in the tooltip.
Save and Preview
- Once you’ve customized and styled your chart, click “Publish” or “Update” to save your changes.
- Preview the page to ensure the widget looks and functions as desired.
Troubleshooting
- If chart doesn’t display: ensure label values and datasets match in count.
- Check console for Chart.js related errors.
- Make sure there are no conflicting scripts or caching issues.
Conclusion
The Pie & Doughnut Chart widget is an essential tool for anyone looking to display data visually and meaningfully. With customizable slices, responsive layout, and interactive elements, it fits perfectly on business, educational, or analytical websites. Use Elementor’s live editor to tweak every aspect and get the exact design you want, effortlessly. Perfect for making stats beautiful and engaging!
Need help? Our team is happy to answer questions on the Sky Addons support page.